Nowadays, our guests expect us to deliver personalized experiences for them. One of the ways to make life easier for our guests is to bundle multiple complimentary items and recommend products so they can add needed items to their carts with a single click. Bundled product recommendations enhance a guest’s shopping experience by allowing them to quickly view and hopefully purchase products that are typically bought together, like a television with a TV mount or a razor with its associated blades. On Target.com, bundled recommendations typically contain the title ‘Frequently Bought Together’ or ‘Compatible Items.’
Figure 1 illustrates a product bundle created for a car seat. When a user clicks on the car seat, a bundle with a baby car mirror, a car seat organizer, and a seat protector is displayed.
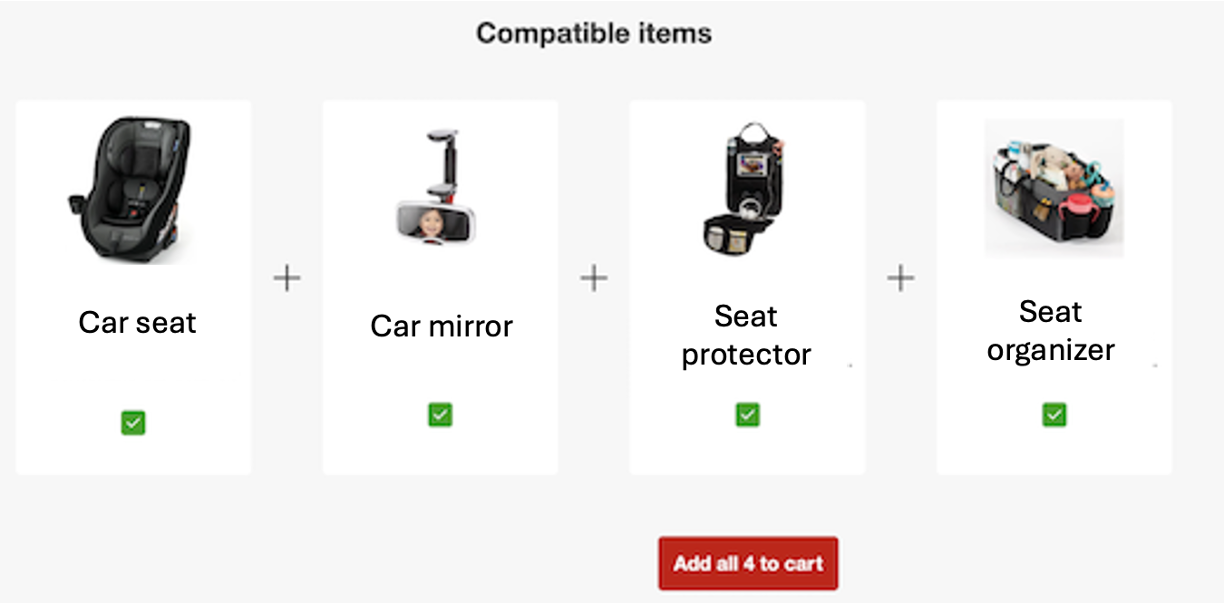
Figure 1: An example product bundle created for a car seat.
For the remainder of this post, we’ll refer to the primary product viewed by the guest as the “driver product” — the product around which the bundle was built — and all the recommended products in the bundle as the “go-together products”.
Bundling Algorithm Evolution
Over the past few years, the Item Personalization team has created several bundling algorithms. Our simplest algorithm uses a technique called Associate Rule Mining (ARM) on product attributes. This algorithm provides recommendations but suffers from many shortcomings; it’s not good at determining which products are driver products (Figure 2), it will occasionally recommend bundled products which are either overly similar to one another (Figure 3) or to the driver product, and it doesn’t provide recommendations for a large portion of our catalog.
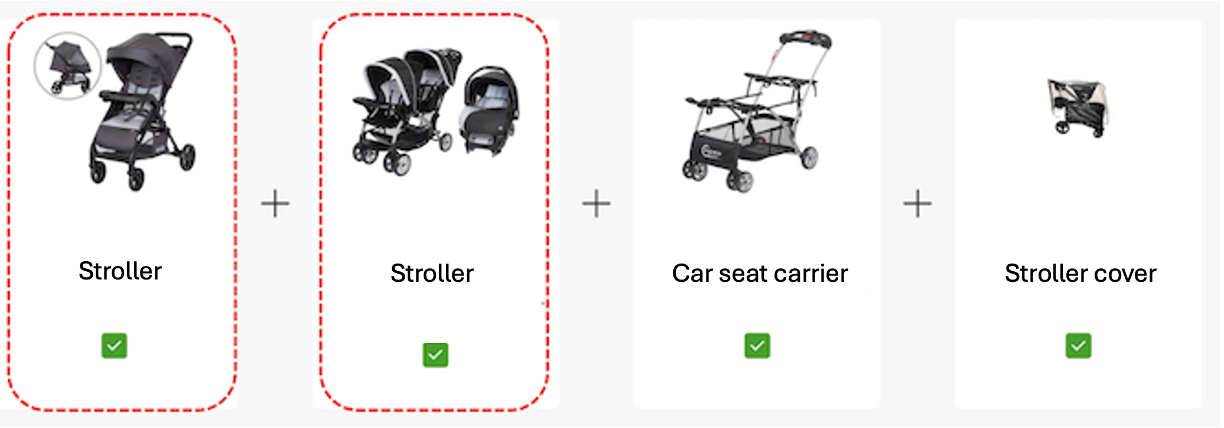
Figure 2: The driver product is not identified in this example bundle.
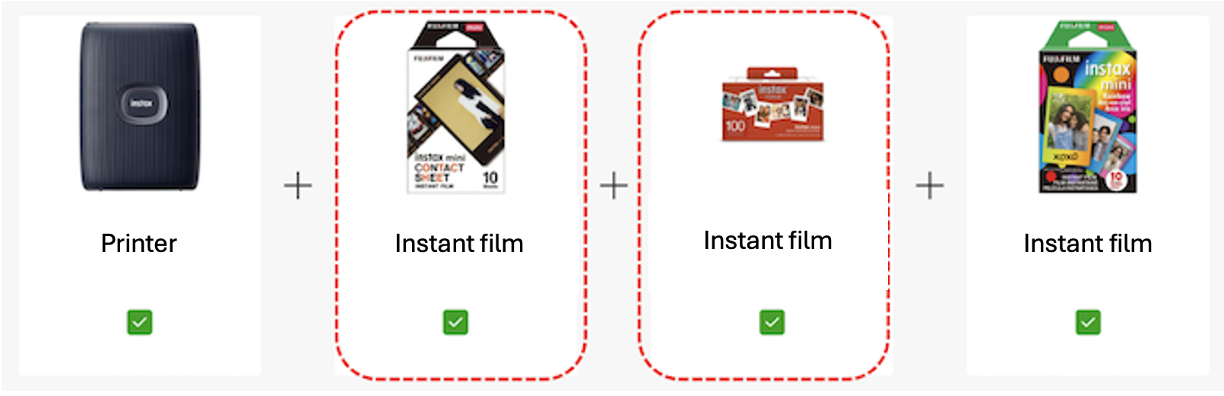
Figure 3: Similar products are recommended in this example bundle.
Bundling using Product Graphs and Graph Neural Networks (GNN)
To address these shortcomings, the team turned to graph-based methods. Figure 4 shows each step for generating bundled recommendations from these methods. In the rest of this section, these steps are explained in detail.
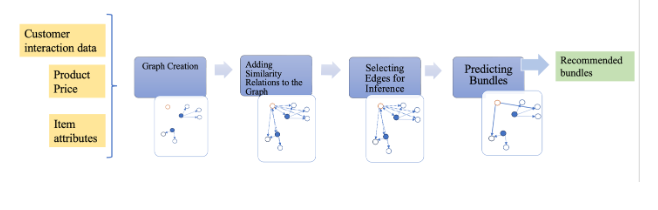
Figure 4: Overall architecture of the Graph Neural Network-based bundling method.
Step 1: Graph Creation
We start by representing the product catalog as a collection of separate product graphs for each product category (e.g., “Kitchen”). Each graph is created with nodes representing products in the category and edges representing relationships between the products. Each edge between two products considers both the count and order of joint purchases and/or adds-to-cart of the product pair, so the graph edges are both weighted and directed. These directed edges let the algorithm disambiguate driver and go-together products.
Figure 5 illustrates an example of graph creation. The guest has added four products to their cart: bodysuits, baby socks, a mixing bowl, and a whisk, respectively in that order. Based on this cart, we form an edge in the Clothing category graph (if one didn’t already exist) from bodysuits to baby socks, {(bodysuits, socks)} ∈ Clothing, and we then increase its weight by one. We do the same in the Kitchen category graph from the mixing bowl to the whisk, {(mixing bowl, whisk)} ∈ Kitchen.
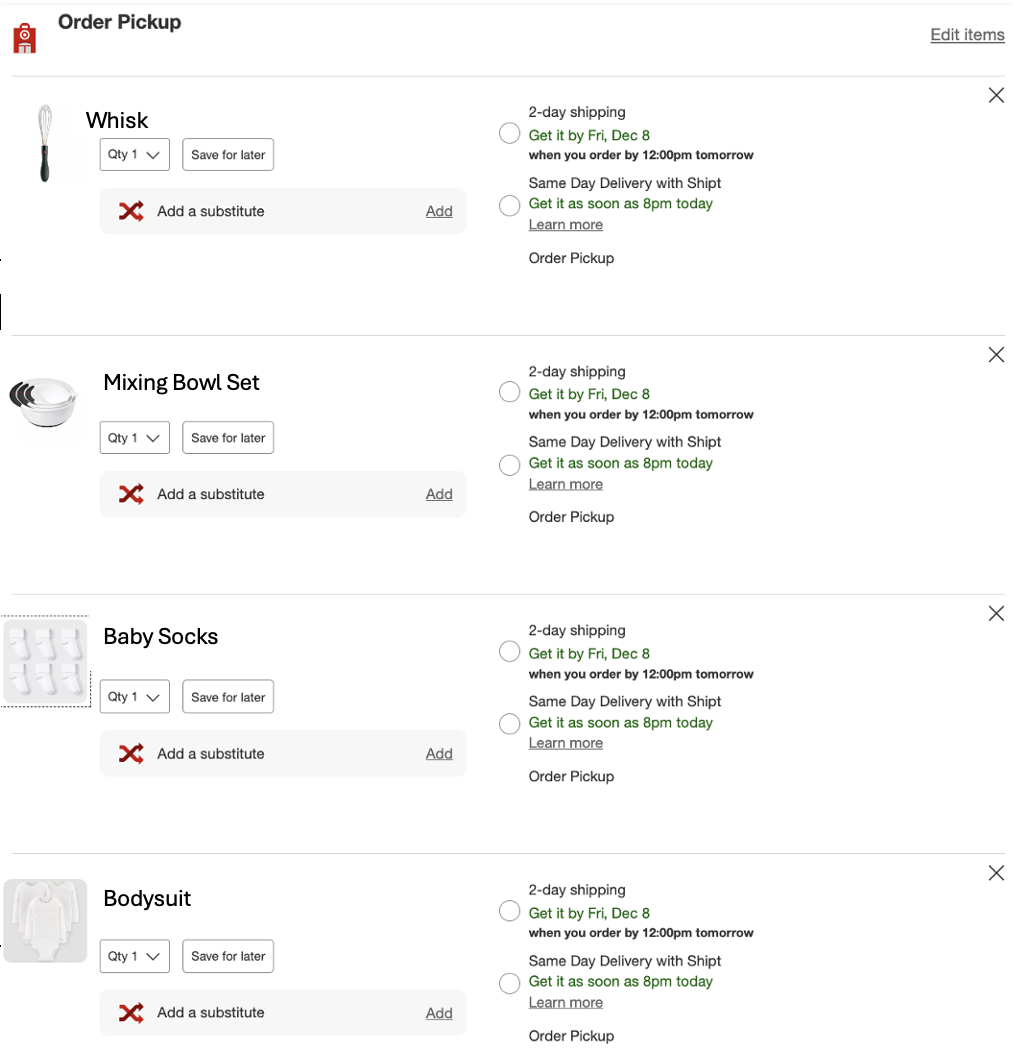
Figure 5: Example of products added to cart in a session by a guest.
After the graph is populated with all guest joint purchases and adds-to-cart (over a specific time period), its edge’s weights are normalized and the graph is reduced by removing edges whose weights fall below a threshold. In Figure 6, the product graph for the recommendations of Figure 1 is shown. All products in Figure 1 are represented as nodes in this graph, and the edges from the car seat to the other three products show that we can recommend the other three products for the car seat.
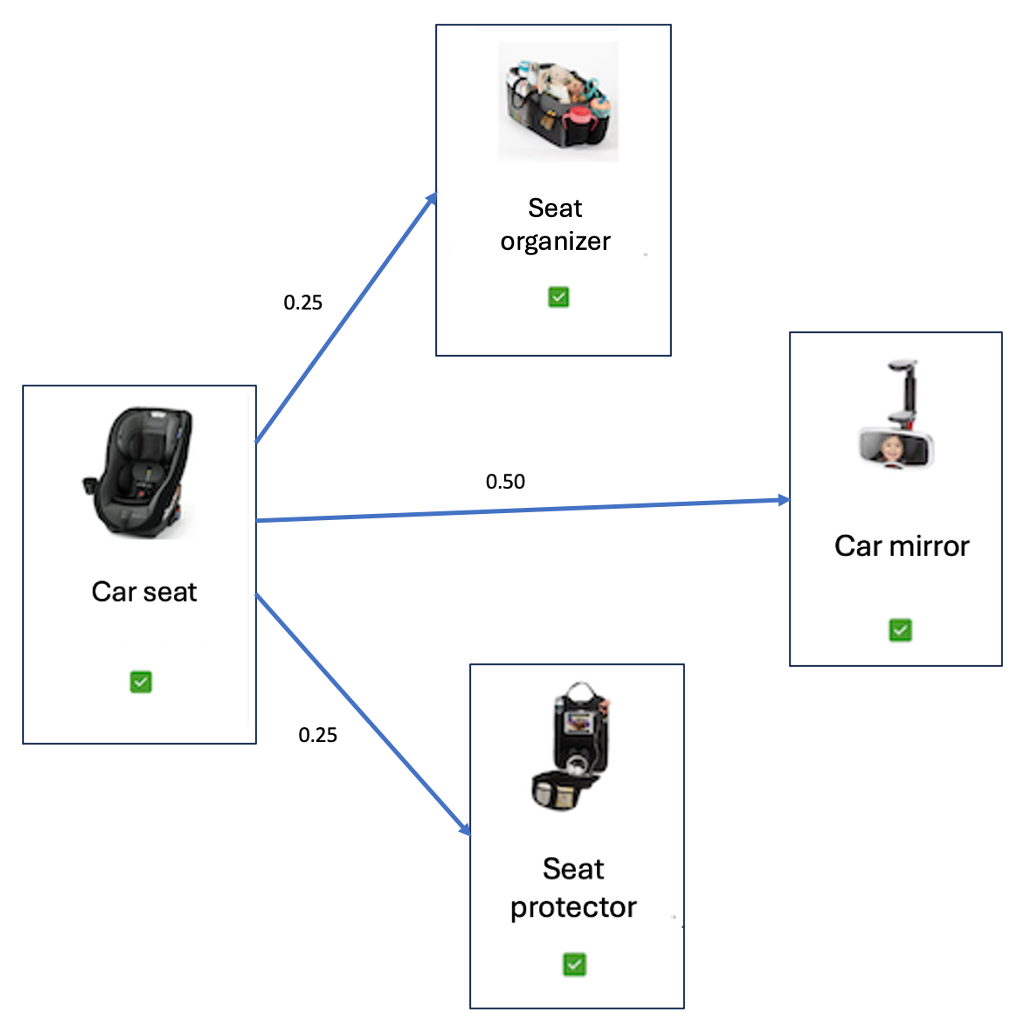
Figure 6: The bundle in Figure 1 represented as a weighted and directed graph.
We initially used this graph as our bundle recommendation algorithm, pulling product pairs from the graph based on the strength of the edges and then applying price and diversity filters to the product pairs. This Complimentary Items (CI) graph approach produced better results than the ARM algorithm, but it still has massive gaps because we have a large catalog, so the odds that any two products have been frequently purchased or added to the cart together are low.
Step 2: Leveraging Graph Neural Networks and Product Similarity for Link Prediction
To generate more product relationships in the graph, we leverage two different techniques. First, we pad out the graph by leveraging product linkages predicted by our Similar Items algorithm (currently used to recommend substitute products for guests). Intuitively, we do this because similar driver products should have similar products in their bundle recommendations. Figure 7 provides an example of this intuition. The bottom car seat has three accessories as part of its bundle recommendation. The top car seat is similar to the bottom car seat, so it could potentially also have these three accessories in its bundle recommendation. Hence, the list of possible recommended products for the top product’s bundle will include these accessories. A complete description of the Similar Items algorithm would not fit here; in short, it creates a distinct graph for each category where the edges represent how similar products are to one another. For each category, we combine the Bundle graph and the Item Similarity graph by taking their sum to form a padded graph.
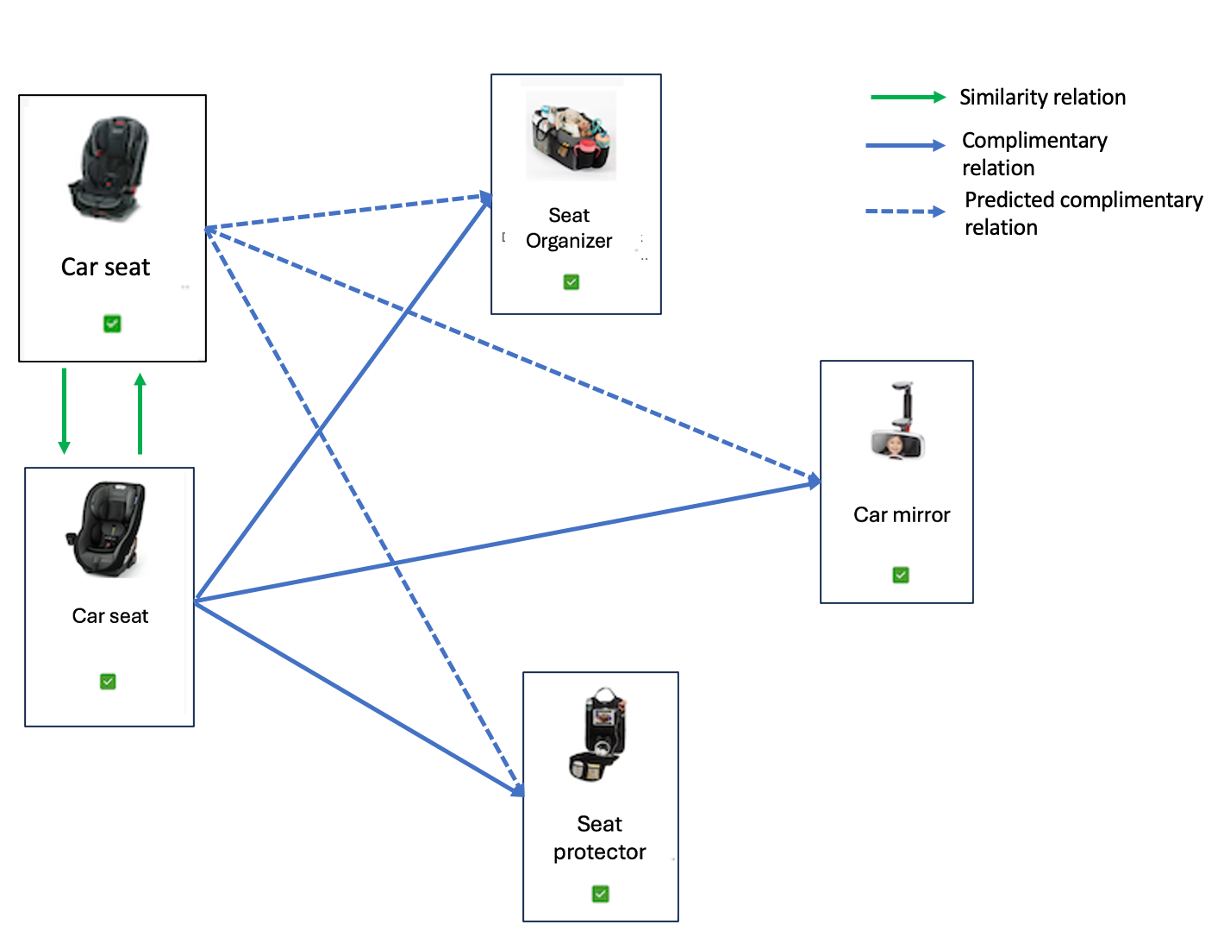
Figure 7: Selecting graph edges for inference based on similarity and complimentary relations.
Second, we train a GNN using the SEAL [1] framework. The SEAL framework is a GNN-based approach that takes node attributes and the subgraph information as input and predicts the probability of the link existence. To make training data, we use the existing edges in the padded graph as “positive” samples and an equal number of randomly chosen made-up edges as “negative” samples. We then use this data to predict if two nodes in the padded graph are connected at two edges (where at least one edge was in the original bundle graph). The GNN learns to predict which product relationships seem plausible, even if guests have never purchased those specific products together and the items’ embeddings did not immediately suggest similarity. After this step, we end up with a larger graph with both real and predicted product relationships.
Finally, we use connections in the resulting graph to generate a final list of potential products for each driver product’s bundle. Depending on where the algorithm is being used, the top K predicted products (K=4 for the Frequently Bought Together headline on a product’s page) are shown to the guest.
RESULTS
We deployed the model to production and A/B tested it over live traffic. We observed over 35% improvement over the existing co-purchase-based model in terms of click-based revenue and over 50% improvement in coverage of products with recommendations. We have skipped the technical details here for brevity, but they are available in our paper [2] for those who may wish to explore this in more detail.
ACKNOWLEDGMENTS
The authors would like to thank Saloni Agarwal and Aparupa Das Gupta for their work on the bundling algorithm [2] at Target.
References
[1] Muhan Zhang and Yixin Chen. 2018. Link prediction based on graph neural networks. Advances in Neural Information Processing Systems 31 (2018), 5165– 5175.
[2] Agarwal, S., Das Gupta, A., & Pande, A. (2022, April). Improving Bundles Recommendation Coverage in Sparse Product Graphs. In Companion Proceedings of the Web Conference 2022 (pp. 1037-1045).