
Target’s purpose of delivering joy is at the center of our decision making. We strive to offer guests a delightful experience at every interaction, and the checkout process is no different. With millions of guests shopping Target in both physical and digital channels, it’s crucial to provide a similar checkout workflow no matter how and where they choose to shop: a uniform, omnichannel experience.
Enterprise Cart & Checkout (ECCO) is the underlying technology platform that powers our checkout experience across Target.com, the Target mobile app, and nearly 2,000 stores. Target is somewhat unique for a large-scale, brick-and-mortar retailer in that all transactions flow through this same platform which enables quick building and scaling of new features and allows guests to seamlessly switch between shopping channels if they choose.
ECCO is built on a mission-critical, cloud-native microservices architecture that equips us to deliver this experience while ensuring our technology systems remain robust, highly available, and resilient. Here are a few practices that have helped us keep ECCO in top shape and should help other platforms and microservices API with uptime as well.
Health Monitoring
APIs served by microservices offer high scalability and easy service management. However, they also have a lot of interrelated service calls. Monitoring microservices in a scalable way thus becomes important. Health checks are one of the most useful methods to anticipate and resolve application issues before they assume greater consequence. These checks are typically used to verify the health of the application – to determine if the performance is up-to-standard and whether the API call leads to the intended outcome.
Health checks help us understand the availability of any microservice – whether the service is functional and able to take guest requests. It can also provide health information that can be leveraged by the orchestrator’s cluster, so that the cluster can act accordingly. For example, Kubernetes has Liveness and Readiness probes that we can use to address health check URLs.
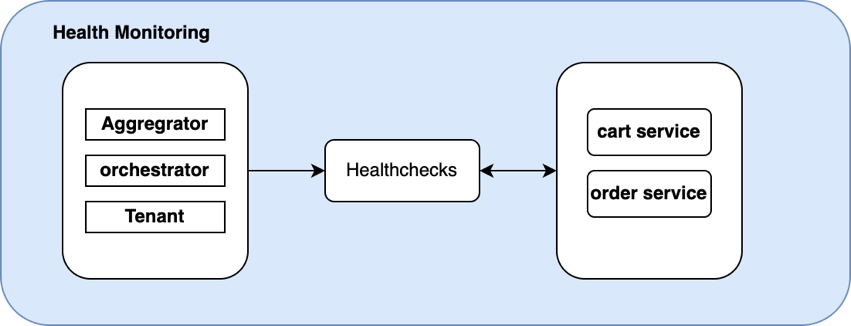
Having said that, a certain degree of unpredictability needs to be accounted for and we should build protocols that can deal with unexpected situations such as network or container challenges. With periodic health checks, engineering teams can identify any deviations in performance and build apps that can sustain incoming requests. Identifying potential issues early on can help alert users of possible impact.
Services Observability with Distributed Logging Using Elasticsearch & Kibana
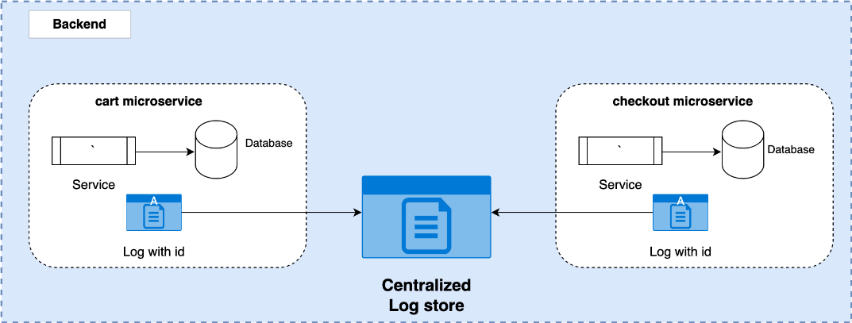
Microservices architecture application logs are generated in containers with complex dependencies. It becomes important for these logs to be stored in centralized locations, especially for analyzing application failures.
Distributed logging is a method used to make these logs available for debugging and analysis. It primarily enables microservices observability, crucial in gaining operational insights into application performance and stability. The most widely used stack is the ELK stack (Elastic, Logstash, and Kibana) that helps teams aggregate and analyze logs stored across systems.
Logging is a critical component in identifying problems in distributed architecture. Centralized logging using ELK makes debugging/logging statements captured by the platform easily accessible and searchable using simple query language coupled with the Kibana interface.
Metrics & Visualization
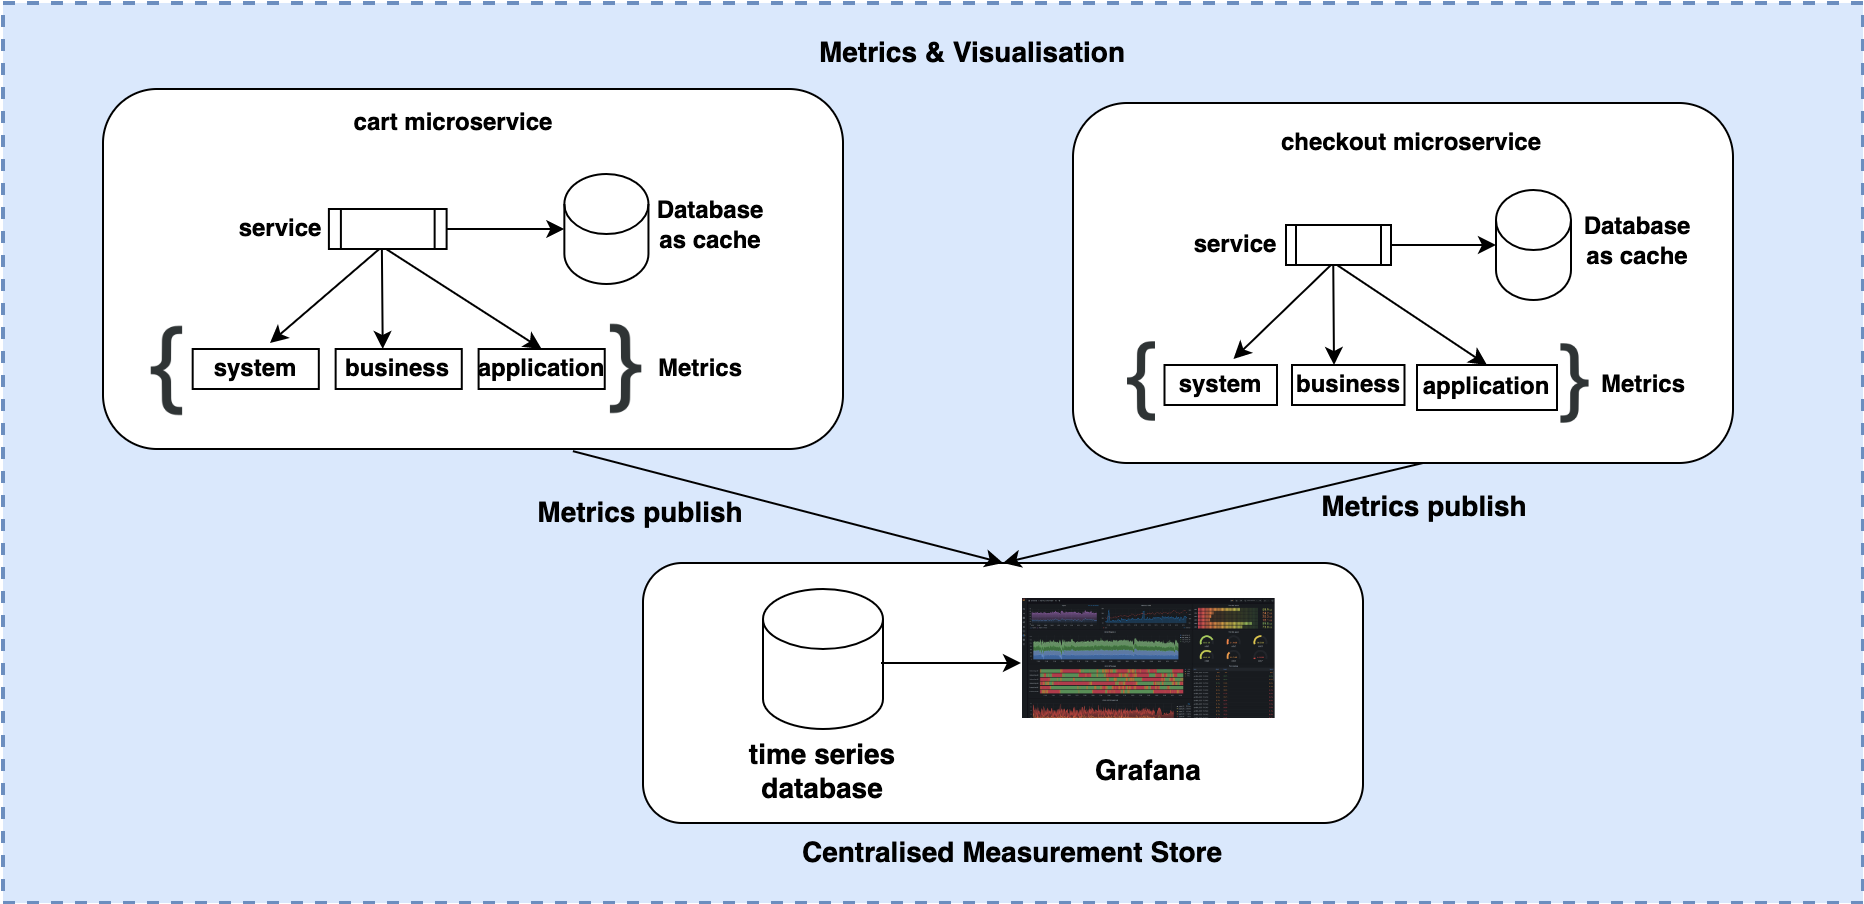
Data, measures, and information on API performance and availability help engineers build features that enhance application resilience. These metrics across systems and the applications captured using metric frameworks are published to a centralized store that data points in a time-series database like InfluxDB. InfluxDB helps aggregate data based on application need, be it in a service host group or time granularity of hour or day or more.
Dashboards and alerts equipped with Grafana help us visualize this metric data while also helping us set up alerts based on thresholds appropriate for each service method. These alerts set as conditions within the Grafana dashboard use metrics that are published and get notified when conditions are met. This alerting system is primarily used to inform engineers of any service issues.
Certain critical alerts that are configured include:
- Inter-data center failover in case of database services
- Service failure rate beyond set threshold value (for e.g., 4xx alerts if count (service request) is > 10%)
Response time alerts (Response time > 1 sec for 5 minute duration)
Summary
Ensuring high resilience and availability of a platform, periodic health checks to alert teams, distributed logging providing relevant information for debugging and API metrics with alerts at required threshold have been our keys to success. These practices help achieve uptime and availability on our services, translating into a more stable and seamless checkout experience for the millions of Target guests shopping with us each week.