
Across Target.com and nearly 2,000 stores, we run a complex and highly distributed point of sale (POS) ecosystem. And as we invest heavily in a great omnichannel POS experience, we continue to develop and scale new features for a variety of applications including store registers and self-checkout, our team members’ handheld myDevices, and our award-winning guest mobile app. As a result, we manage more software with a growing number of interactions – a single scan of an item during checkout could mean touching a distributed tree of dozens of services, with hundreds of thousands of these done per minute.
Triaging in this environment is challenging. Even simple operations, such as scanning a single item’s barcode, can span multiple teams and multiple products because of the many services involved. When incidents are identified, engineers from those teams come together to identify the root cause. Typically, that means digging through their services to search for information that may relate to the issue. During this time, engineers share links to their dashboard panels and logs with each other, however, it is hard for any engineer to digest and understand all the competing information at once. On top of that, it is extremely difficult to trace a single operation all the way through all the services that back the initial operation. All this time spent sharing and digesting information extends time to identify and repair the issue at hand.
To change this, and more quickly pinpoint the source of a problem, we needed the following capabilities:
- A single visualization of operations in a store that all teams can easily digest
- A straightforward way to visualize where in the POS ecosystem a fault may be occurring
Intro to Distributed Tracing
Distributed tracing (or simply tracing) is a concept where a single id, a TraceID, is attached at the topmost operation and then passed down to all dependents of that operation. It requires coordination between all services to ensure that this top-level id passes through each service on to its dependents and creates a hierarchical graph visualization at the end. As each service receives a call that contains a TraceID, it will also generate an id and attach it to any calls it makes to its dependents. This creates a parent/child relationship between the numerous services. This parent/child relationship as well as how long the operation takes is called a “span.”
The following diagram shows a hypothetical POS architecture
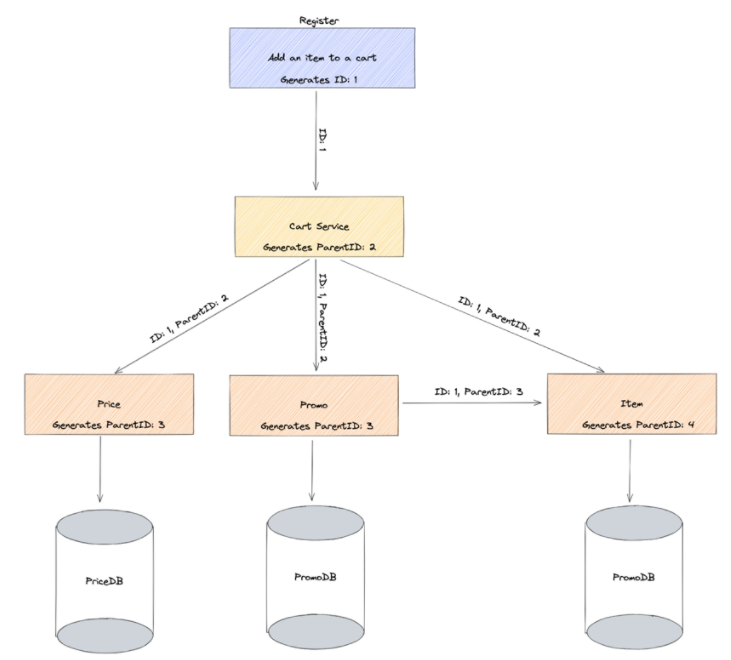
Each service is generating a span to represent itself and how long it takes to complete its operations. The following diagram shows what this would look like if it were visualized based on the above system.
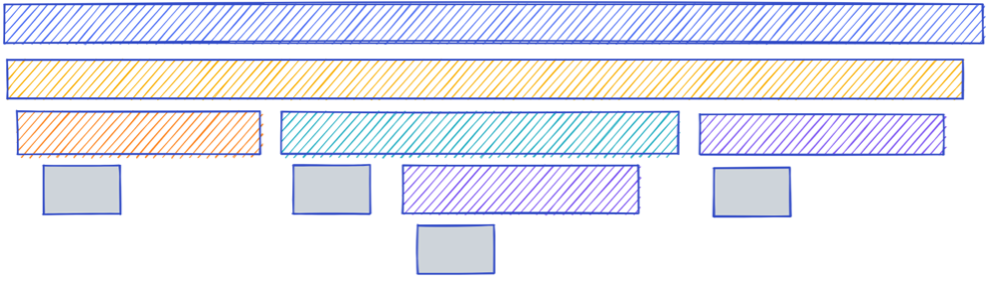
As you can see, for this single experience of adding an item to a cart on a register, 10 spans would be created overall.
In the past there have only been two main open-source projects for collecting this trace data: Jaeger and Zipkin. Over time, the community came to the realization together that tracing is only one part of the overall picture in observability. This collaboration started the OpenTelemetry Cloud Native Computing Foundation (CNCF) project.
Tracing at Target
The main pain points of implementing tracing are:
- Each application needs to be able to accept and pass on the Trace context (TraceID + ParentID)
- Something needs to be able to accept and store these traces as well as potentially operate on them
- Something needs to be able to visualize the stored spans/traces
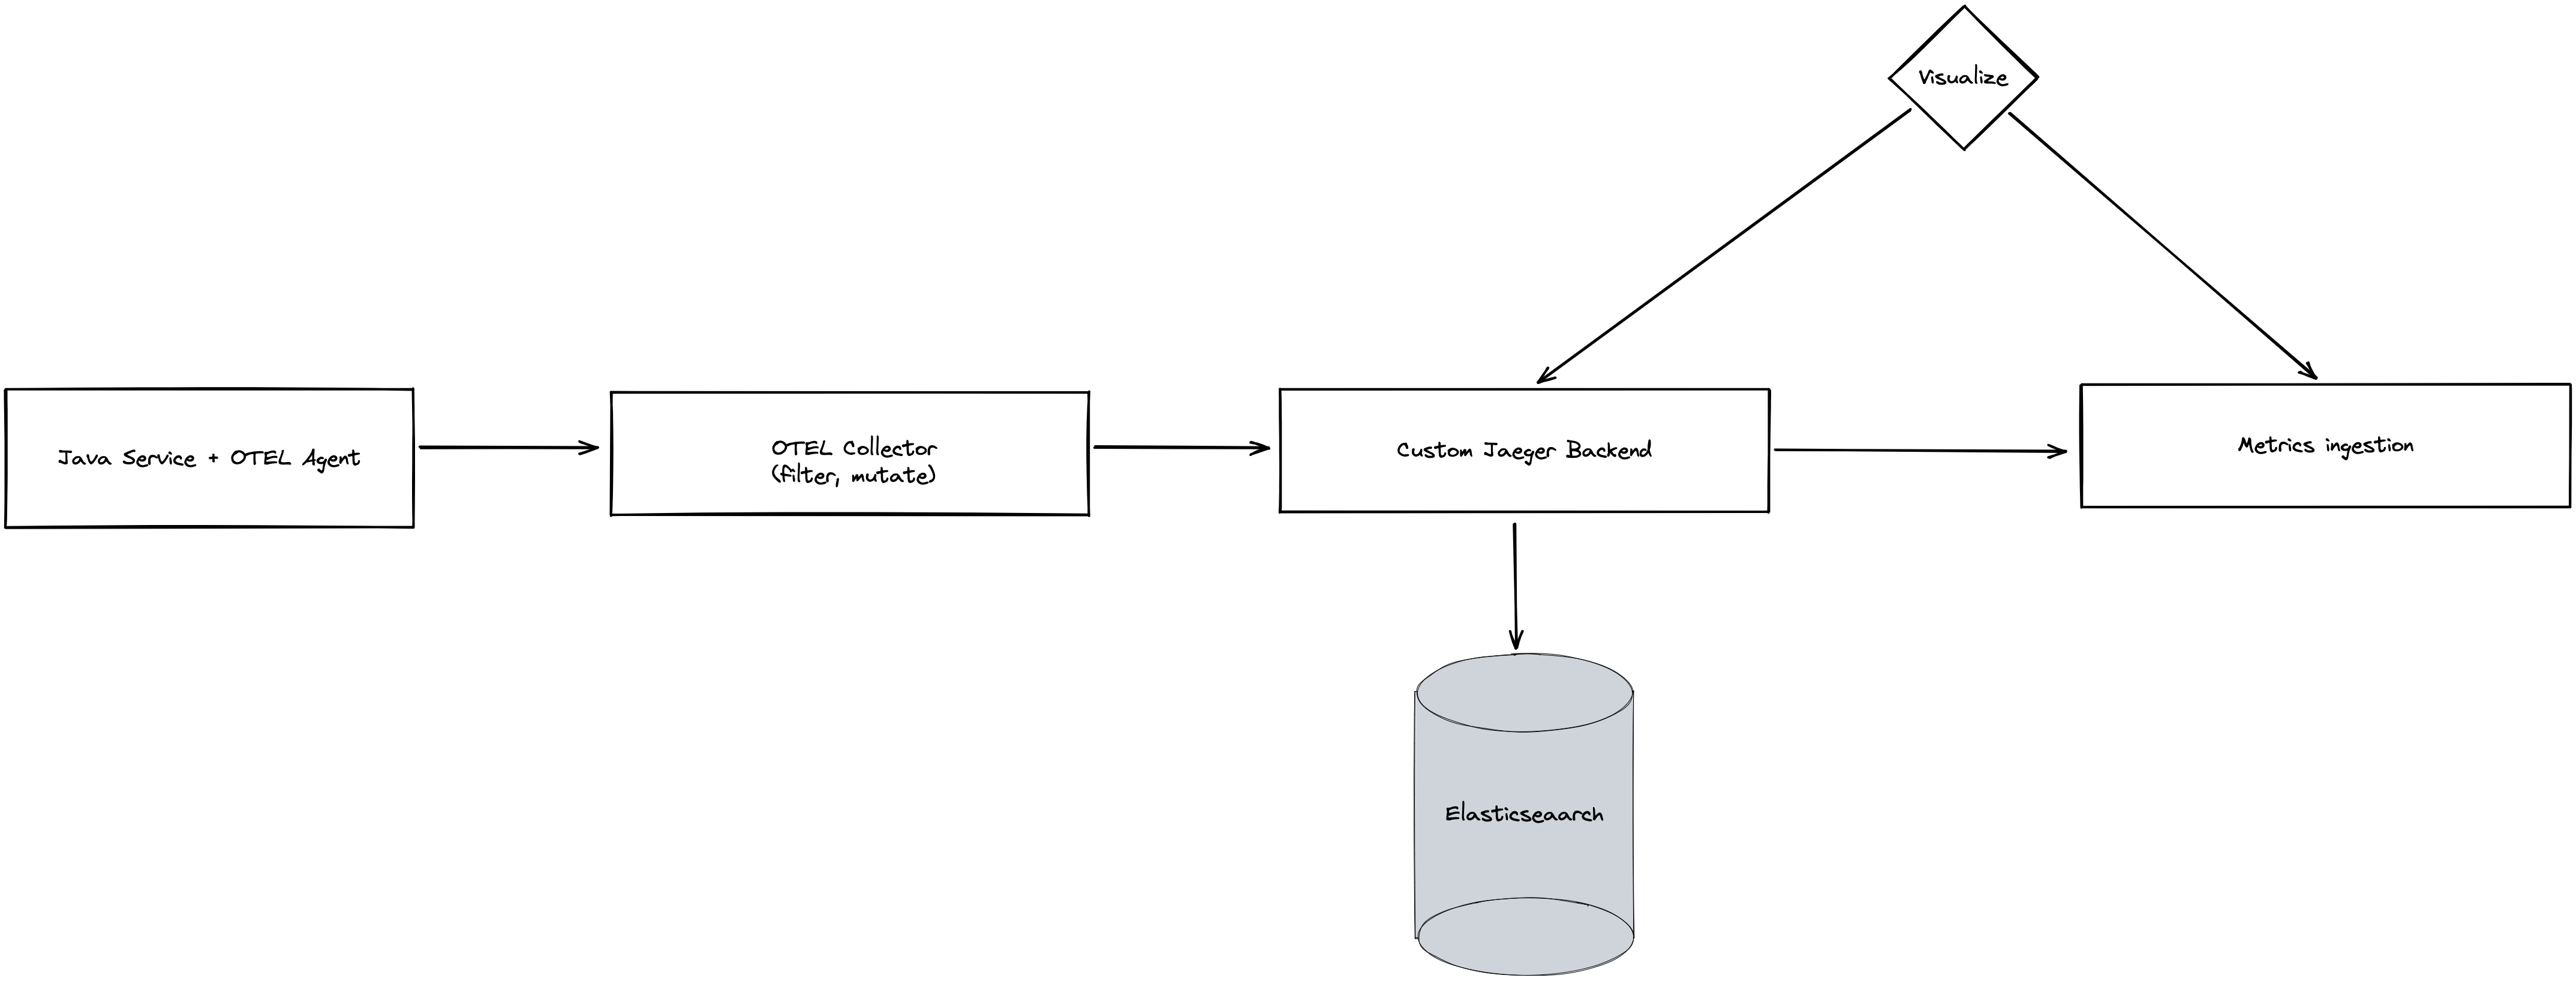
Many applications are written for Target in Java. Since the OpenTelemetry community provides a Java agent that can be injected into any Java Virtual Machine (JVM)-based application, this made the onboarding process for application teams easy. Using our open-source CI/CD framework Vela, we were able to build a custom plugin that teams could simply copy/paste into their existing Vela pipeline. This plugin injects a few steps into their existing Dockerfile that adds OpenTelemetry for their application and enables tracing automatically for their service.
The next hurdle was how we would be able to accept these spans and then store and visualize them. The community OpenTelemetry Collector solves the issue of accepting the spans and can mutate and emit spans in any standardized format (Zipkin, Jaeger or OTLP).
The only pieces that remained were the ability to store and then visualize the spans. To do this we implemented a custom processing service that is built on existing Jaeger components. This service stores the spans in Elasticsearch as well as any other custom logic that we need, not yet implemented by the OpenTelemetry Collector. Eventually we plan to contribute these features back to the OpenTelemetry community to help other engineers who are facing similar challenges. One such capability that we have built allows us to convert http spans into metrics that are emitted to the Target Metrics Pipeline.
With all these pieces in place, we only had to implement custom tracing within our POS flagship app that handles all our front lane, Starbucks, food court, and guest checkout experiences. These customized spans coming from the flagship app allow us to break down a single add-item operation at the register into a backend system span and the “add item to screen” span. Together, these form a key service level indicator (SLI) that we monitor on our Site Reliability Engineering (SRE) team for register health while also providing a single visualization pane of the entire stack of services that back this operation.
Here we can see a visualization of an add-item call based on the hypothetical POS architecture from above.
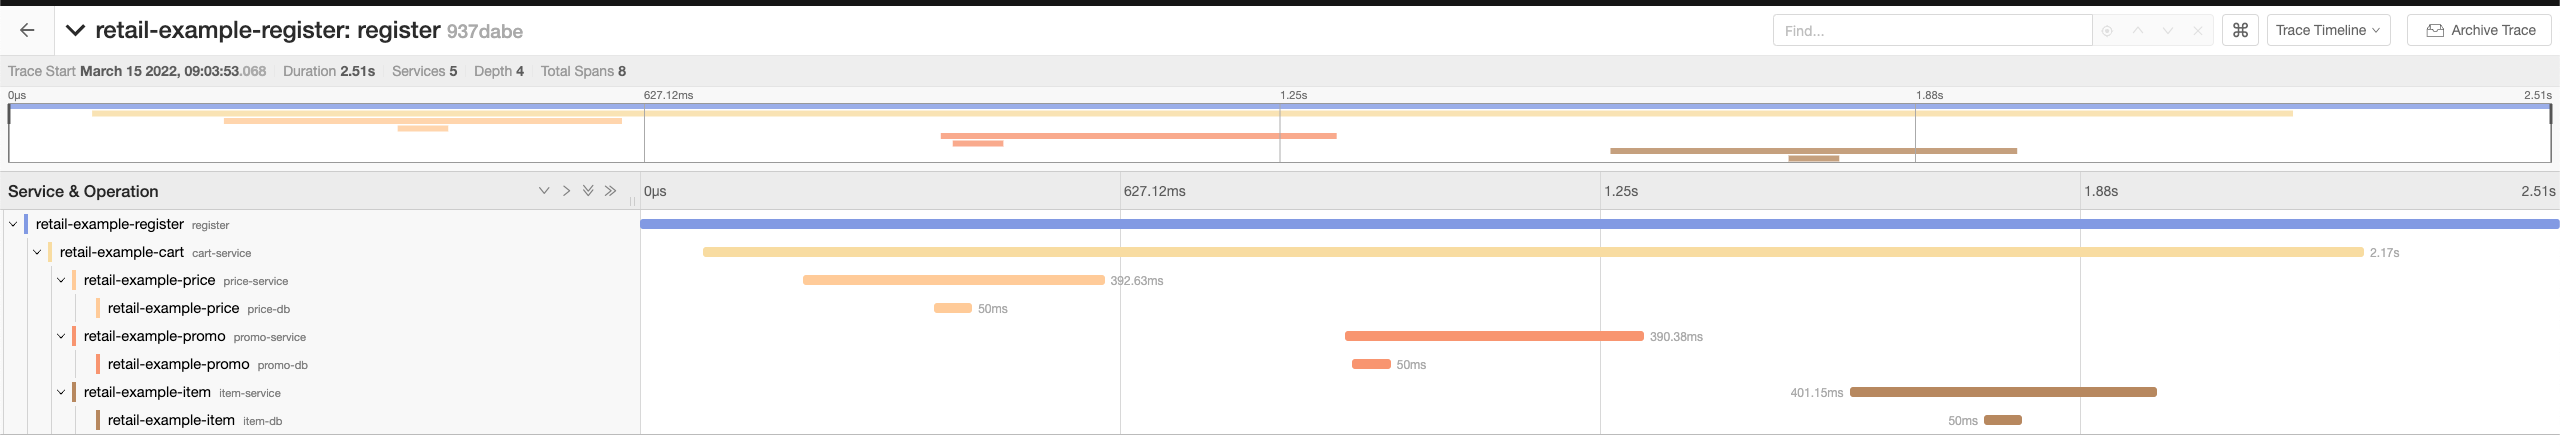
The UI then allows us to quickly identify where errors occur to help pinpoint issues.
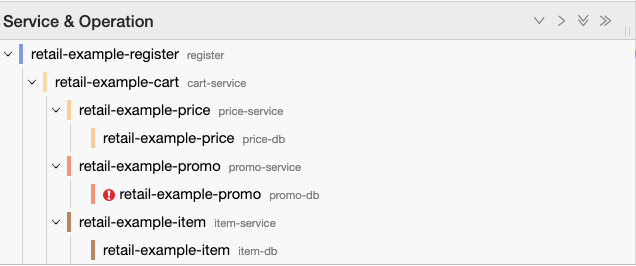
These visualization capabilities allow engineers from any team to quickly come to a standardized location to triage a potential issue we come across. We now spend less time sharing information back and forth which leads to noticeably shorter mean time to detect and mean time to repair for incidents. Our investment in distributed tracing has enabled us to streamline the process and maintain a reliable Target experience while we scale software and infrastructure to deliver joy for our guests.