

Stateful Apps in a Stateless World
Apache Cassandra has been used for many years at Target - since around 2014. This year, however, we had a new challenge to overcome (actually... two challenges!). First, we needed to deploy an individual Cassandra cluster inside all of our stores, and then these clusters needed to run inside Kubernetes. Cassandra is a database for persistent workloads, and in the past has not gotten along nicely with ephemeral environments. We needed to come up with a way to deploy Cassandra as a Docker container in Kubernetes, while still maintaining stability and consistency.
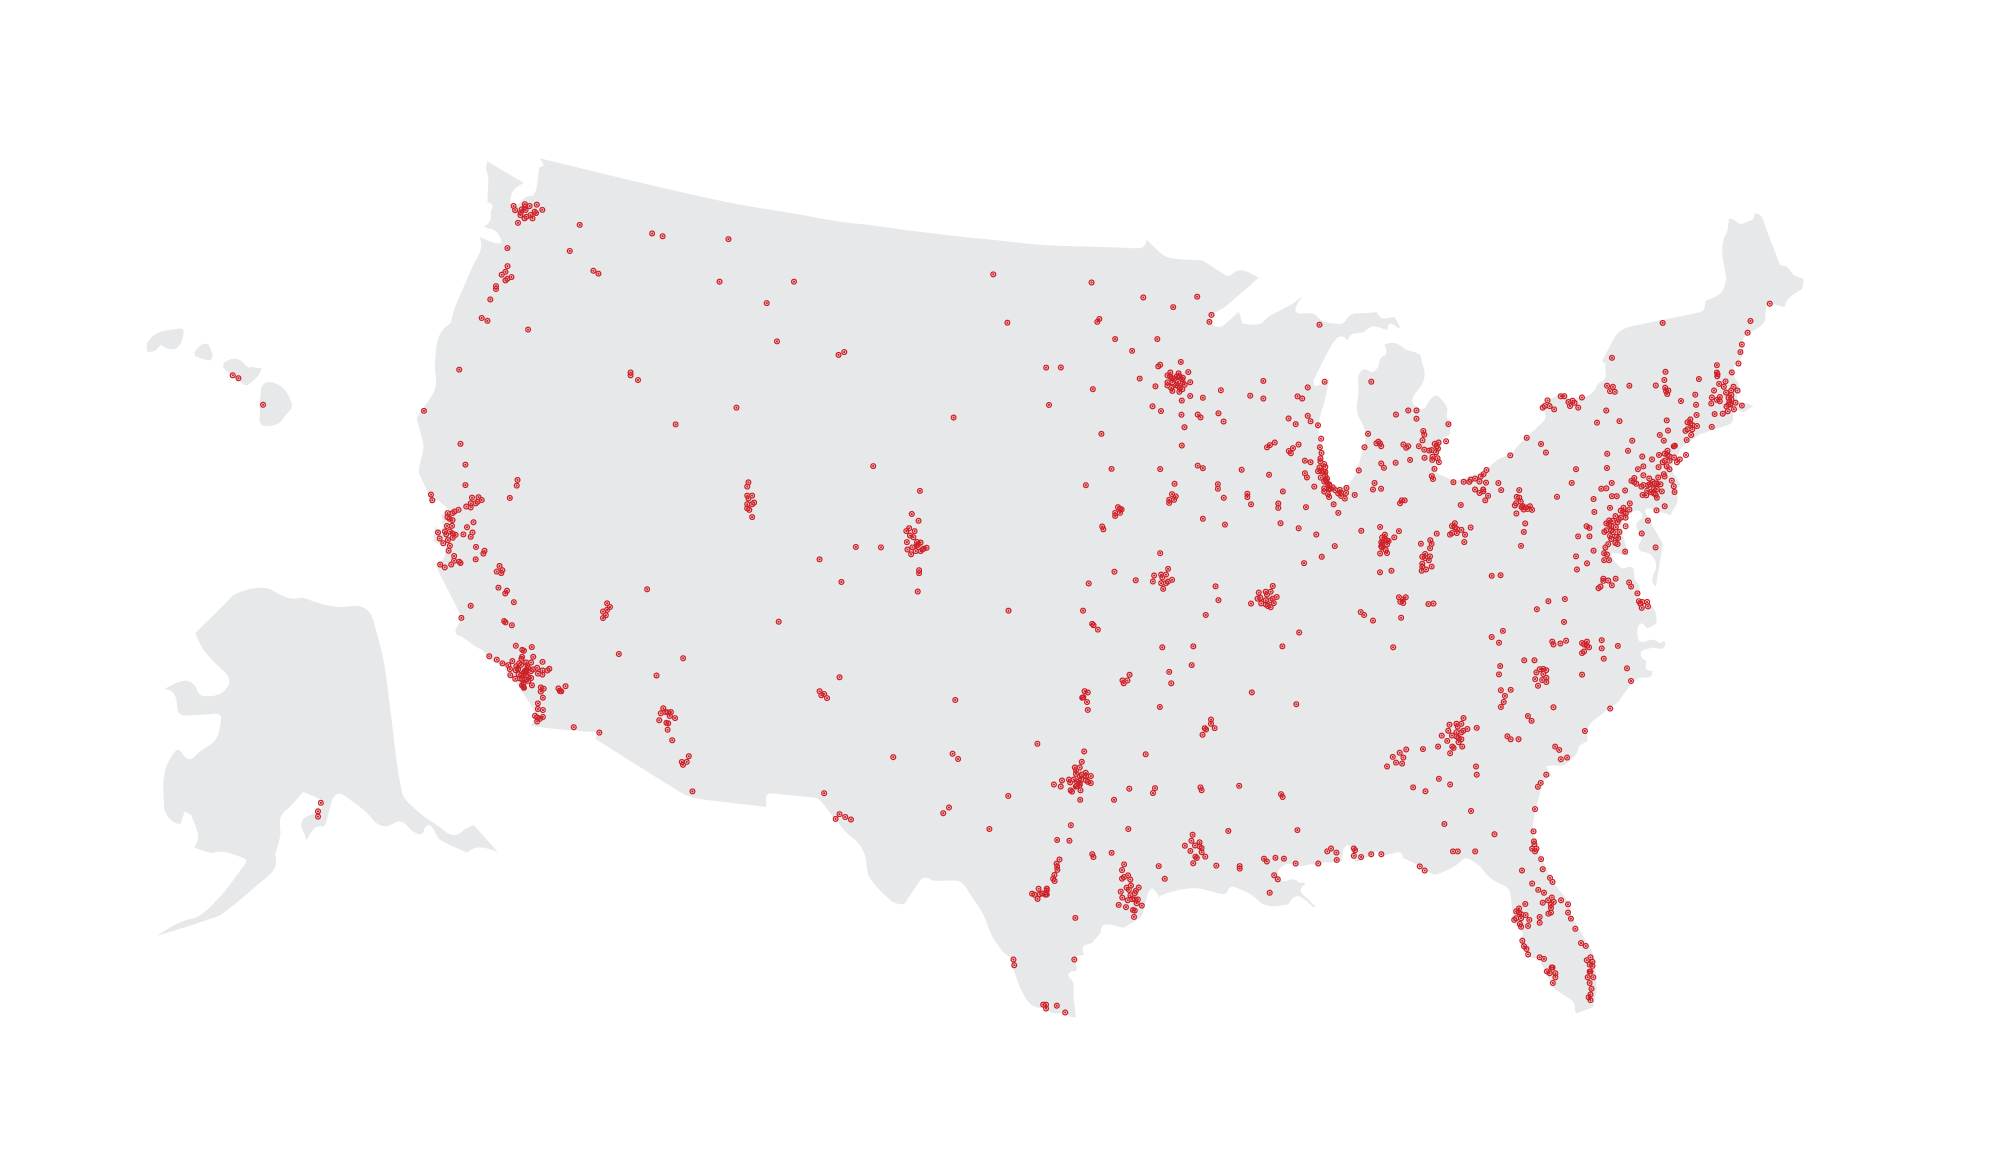
Then on top of those challenges, we had to make that happen reliably in every single location on this map.
A lot of the heavy lifting was already done for us when it comes to deploying across tons of Kubernetes clusters. We leveraged Unimatrix, built at Target, to do most of the management for us. It's a good read if you want to learn the story of creating unimatrix.
Also if you're interested in how we do Kubernetes at Target, you should watch this talk from Google Cloud Next '18.
Clustering in the Dark
When we first started planning an Apache Cassandra deployment in Kubernetes, the first thing we wanted to solve was the clustering component. Normally with Cassandra, you would deploy a single node, or set of nodes, to act as a "seed" that additional nodes would use to join the cluster. However, in Kubernetes, our nodes will get an IP allocated inside of the Kubernetes environment when they're created, so we needed to find a way to make them discover one another and form a cluster. We needed to do all this without knowing what IP address would be assigned to any of our Cassandra pods, nor did we know how long those IPs would be valid for, since things can be redeployed often in Kubernetes.
To solve this we created a "peers service." It's registered in Kubernetes just like any other service you would deploy there, but the peer service is headless. The configuration looks something like this:
apiVersion: v1kind: Servicemetadata: labels: name: cassandra-peers name: cassandra-peersspec: clusterIP: None ports: - port: 7000 name: intra-node selector: name: cassandraRather than being load-balanced through a single IP, thanks to the clusterIP: None, the service is a passthrough directly to all of the IPs behind it. That gives us a way to look and see if there are other healthy running nodes in the environment. If there are, the service's DNS name will resolve to one of the Cassandra pod's IP address. When a Cassandra container starts up, it does an easy DNS lookup on this service as part of the Docker container entry point:
# get the first IP that is returned from our peers serviceif [ ! -z "$PEER_DISCOVERY_SERVICE" ]; then CASSANDRA_SEEDS=$(nslookup $PEER_DISCOVERY_SERVICE | grep -v $my_ip | awk '/^Address: / { print $2; exit }')else echo "Peer discovery service is not defined, using localhost"fiThe open source Cassandra Docker image we started with uses the CASSANDRA_SEEDS environment variable if present or defaults to 127.0.0.1 if it's not set, so all we needed to add was this small piece of script.
Startup Negotiation
Even after we were able to cluster our Cassandra nodes, our initial testing showed we were experiencing issues with nodes still coming up unclustered when we deployed to a store. Our problem was with multiple pods starting up at the same time. When this happened, the image was moving past the cluster detection step because none of them were yet healthy and registered with the peers service. Since all of them came up at the same time, they would form three separate clusters, and not cluster together as we wanted. To address this, we wrote a small init container we called the cluster negotiator. This init container attempts to detect other init containers of the same type and communicate what to do next.
func ReturnStatus () func(writer http.ResponseWriter, r *http.Request) { return func(writer http.ResponseWriter, r *http.Request) { reply := &request.Reply{} fmt.Println("Received request") switch os.Getenv("status") { case "startup": os.Setenv("status","hold") reply.Status = "continue" case "hold": reply.Status = "hold" } fmt.Printf("Sending request reply of %s", reply.Status) render.JSON(writer, r, reply) }}The code section above describes a reply when one container finds another. First, it tells that pod to continue onward and moves into a waiting state where it will tell any other of the same image that start to also hold on. Then the one or many init containers keep checking for a Cassandra database to come up and register with the peers service. When they find one, they all exit and allow the Cassandra entry point to run, and then it finds a seed node and is able to join the cluster. Pretty cool, right?
Persisting Your DATAbase
A clustered database is great, but it's a common requirement for applications that their data doesn't just periodically go missing. A good mindset when deploying into Kubernetes is just to assume that your pods are going to disappear, get replaced, get rescheduled and generally just not be where or what they were the last time you checked on them. It's pretty obvious that marrying these two concepts - ephemerality and persistence - presents some challenges. Each of these Cassandra databases needs an underlying data store that won't get wiped every time the Kubernetes pod restarts.
Solution one for this issue was external storage and really falls under Kubernetes Solutions 101. We mounted our data directories to static paths on a SAN that lived outside the Kubernetes cluster and mapped them into the Docker pod, so even if the pod got destroyed when it came back up and looked in its /data directory, that was /node1/data on the external storage. Thus, the database information was just as the old pod left it. This worked... for a while. But then we started seeing this extremely disheartening message very frequently:
org.apache.cassandra.io.sstable.CorruptSSTableExceptionThat split the nodes of our Cassandra cluster across the physical node structure (three hosts) of Kubernetes, and then we did the same static path mapping for the data directories into the Kubernetes host volume. We're slightly restricted that each node can only be allocated on a single blade of the Kubernetes cluster, but the data from the database is persisted, which is essential. This also limits us to a three-node Cassandra cluster - but that's plenty capacity for our use case.
Monitoring and Alerting
Monitoring is especially important when you're running in an ephemeral environment like Kubernetes where things can so frequently go sideways. Combine that bombastic nature with the fact that this deployment will be mirrored across 1800 geographically different locations, and there's simply no way we can live without monitoring and automated alerting. To monitor the first thing we wanted/needed were metrics. Thankfully metrics are (relatively) lightweight - so it doesn't take a lot of extra processing power to manage them.
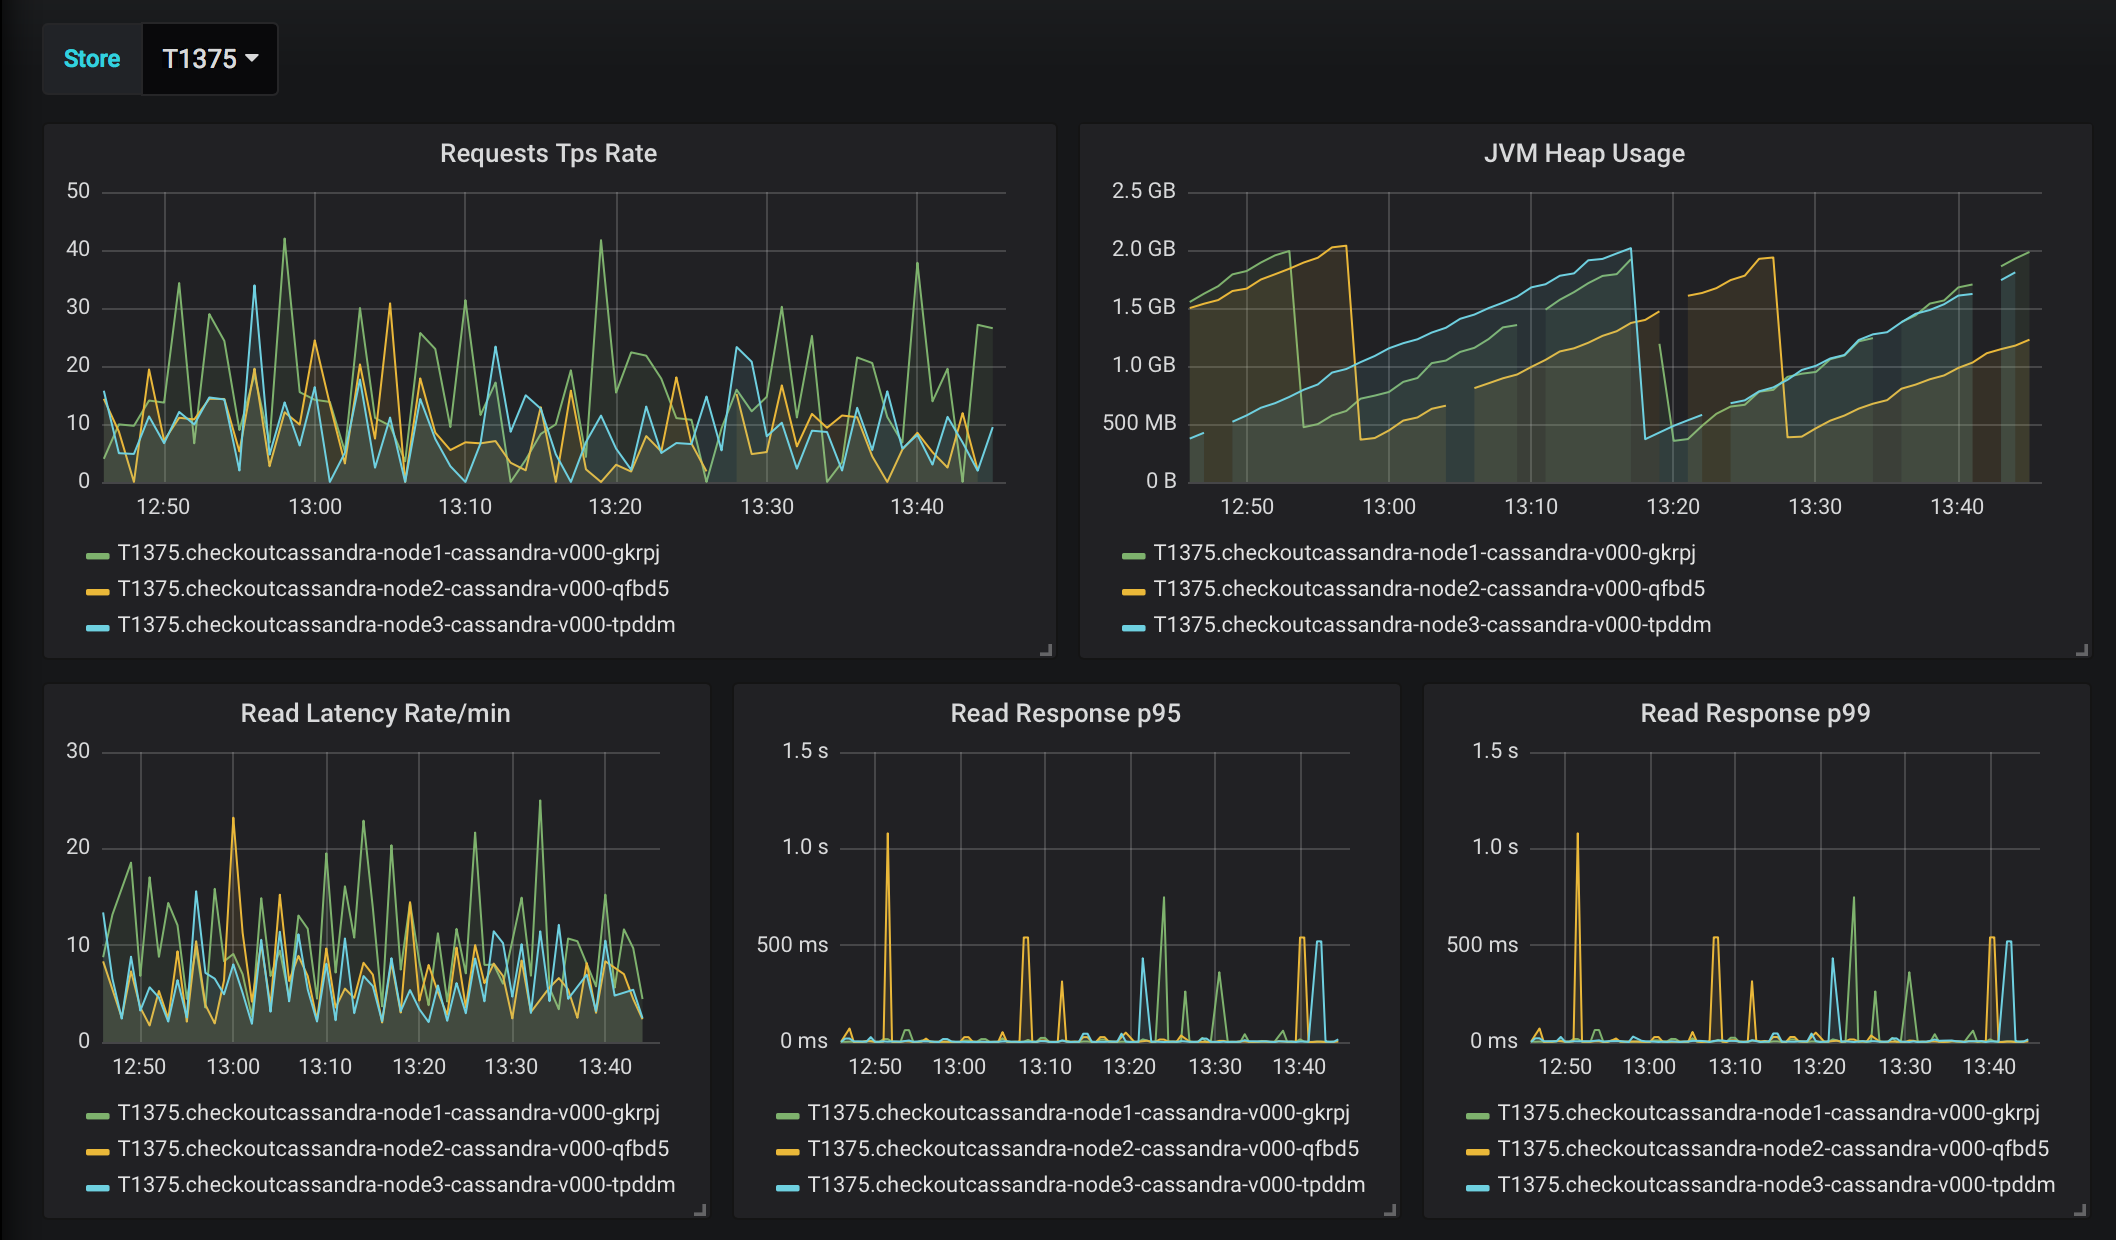
For our Cassandra metrics we attached to each of the deployed nodes a small Telegraf sidecar with the Jolokia plugin that's standard for getting metrics from Cassandra. We supplied the sidecar with an environment variable that would tell us the location it was in, and we streamed our metrics into the normal pipeline used for applications. With that, we built dashboards that can provide us with a detailed view of the Cassandra cluster health per location as well as set up alerts that would tell us when our cluster or node performance was outside of healthy and let us know the node and location of the problem.
Is It Working, Though?
Even with the monitoring in place, when we're spread across 1,800 stores and looking to provide a critical service for store operation, there was another level of concern we wanted to address that we can't really interpret just from being able to see disk i/o. The all-important question: Is it working? And how do you know if it's not?
To address both of these, we wrote our own little synthetic transaction monitor into a Docker image. We deployed it as a separate application that sits in each location and lets us know if we're good or in trouble. The monitor, in addition to doing a pretend purchase periodically and writing out the success or failure as a metric, actually attempts to make a Cassandra client connection to our Cassandra service so we know if our app can use the database. The monitor also gets a full cluster status out of each node, checks if all the nodes are clustered, and sends alerts through our alerting integration if any of them show up in a down status so someone can investigate and fix any issues.
![screenshot of an auto alert in Slack that reads "Attention: Store - T1455 would like you to know Cassandra node [REDACTED] is reported DN by [REDACTED]"](https://target.scene7.com/is/image/Target/shuttleio-220329-1648586042969?scl=1&qlt=80&fmt=png)
Which leads us directly into our next challenge.
Visibility and Support
Things unfortunately go wrong - hard truth - and we needed a way for our application partners to get at underlying logs and Cassandra data without needing to interact with the Kubernetes cli, know what namespace a store is in, or have the passwords and tokens to get access to all of that information. To that end, we built a web app which lets our partners (and our team) find logs by store and pod, search them, query the Cassandra clusters in each store, and even fix some common issues like resetting a node with corrupt data or making an update to a schema in the cluster. We have more plans for it, too, like verifying schema consistency and running sanity tests on demand in a single store or across an entire Kubernetes namespace.
TL:DR
We had a lot of hurdles to overcome in deploying Cassandra clusters to all Target stores, but we were pleased to find that it's actually working quite well after some initial struggles. Through the process we built a platform that we know how to deploy, can keep highly available, know if it's working and get told when it isn't.